• ULV Resistor Thermal Report: Datasheet Deep Dive Quick Guide

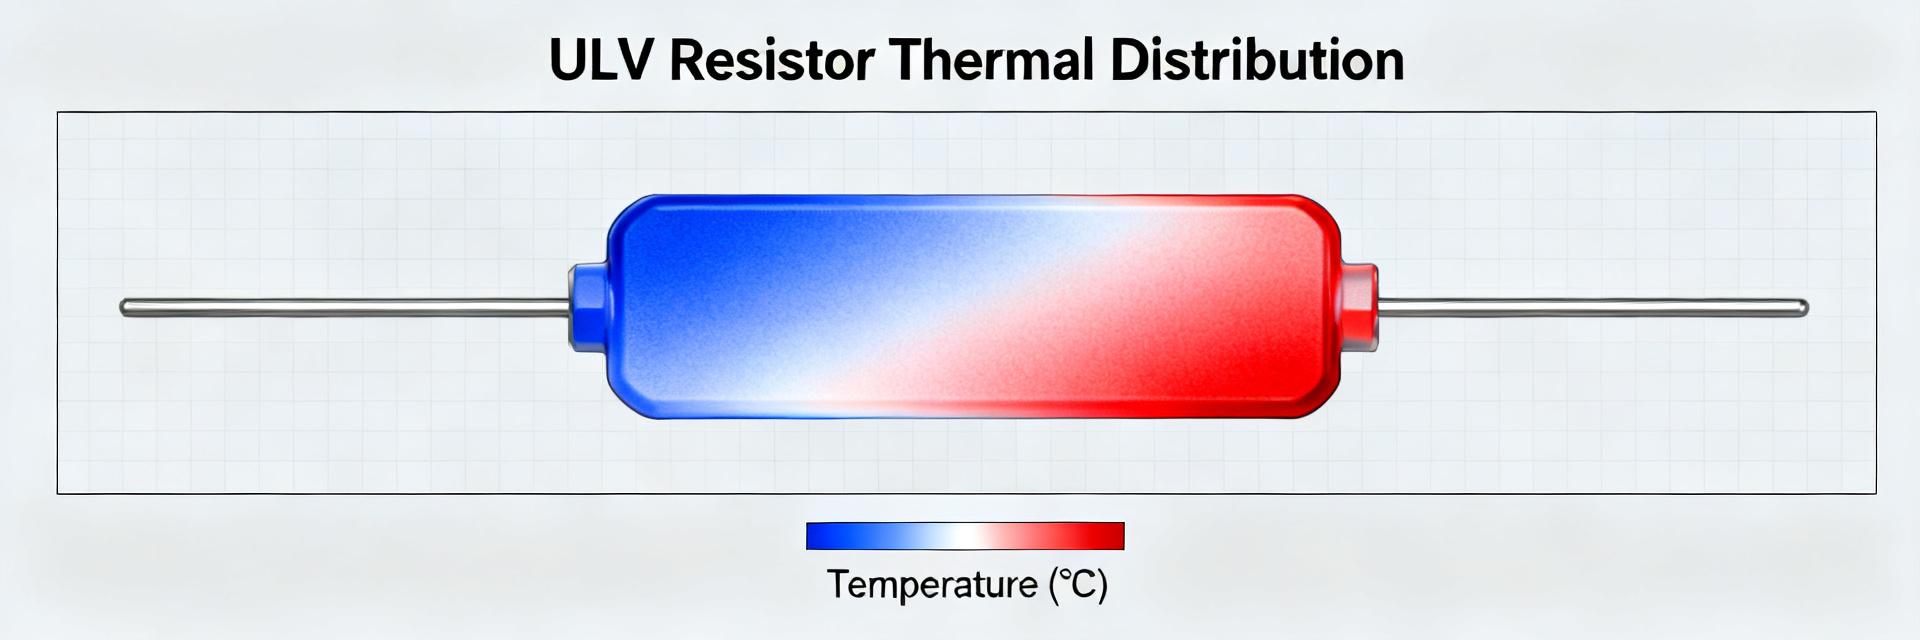
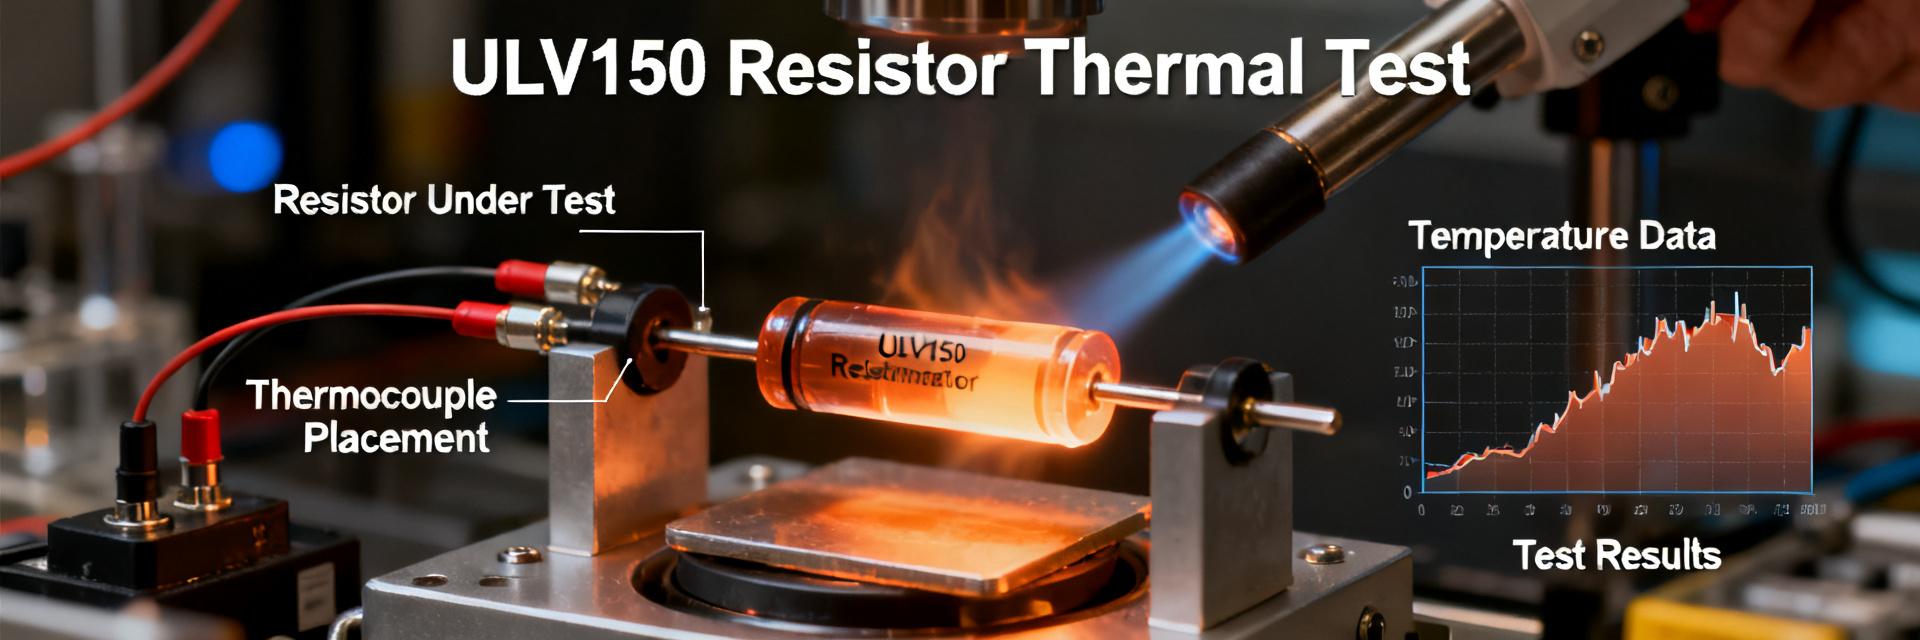
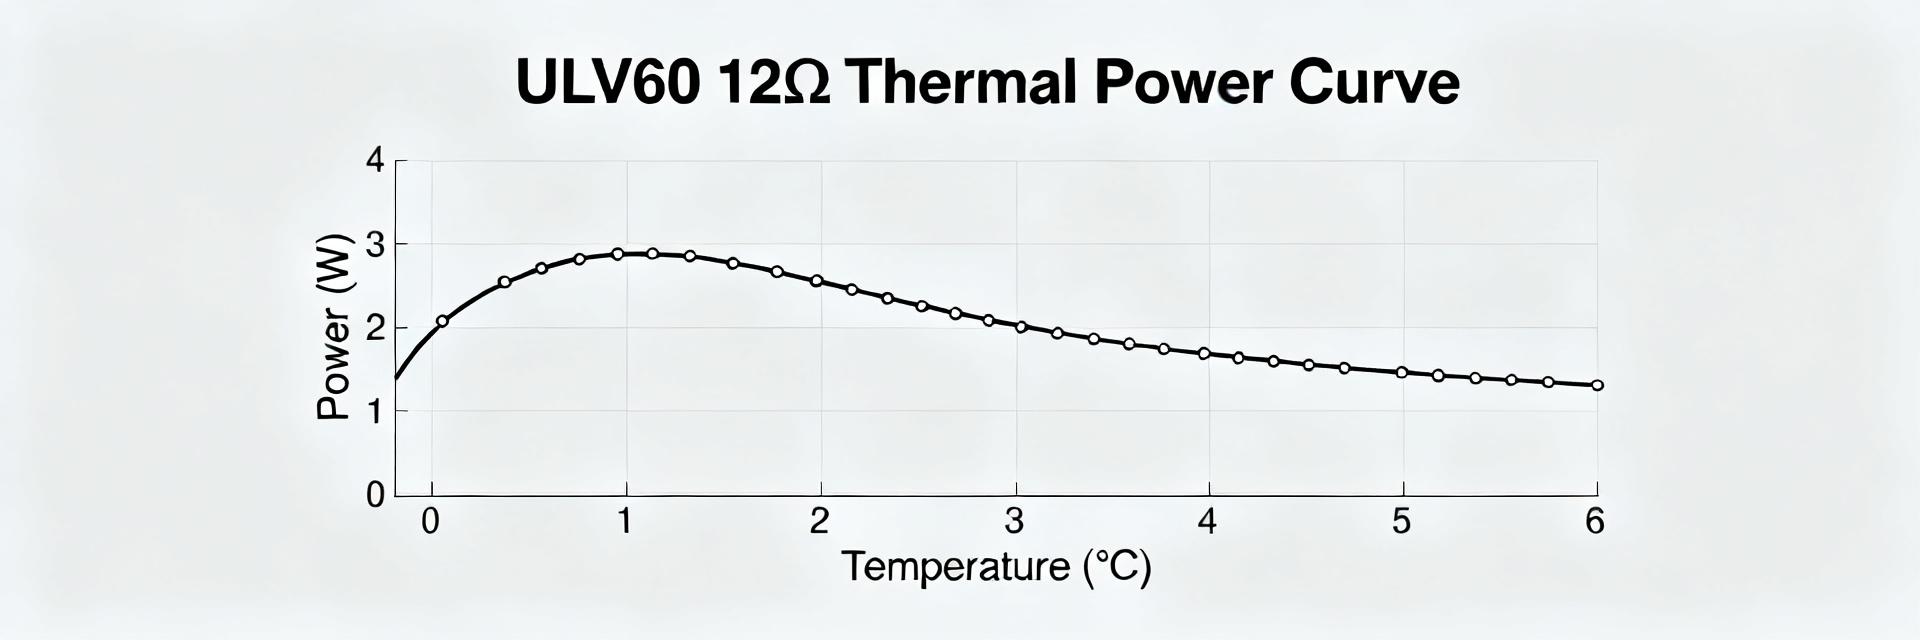
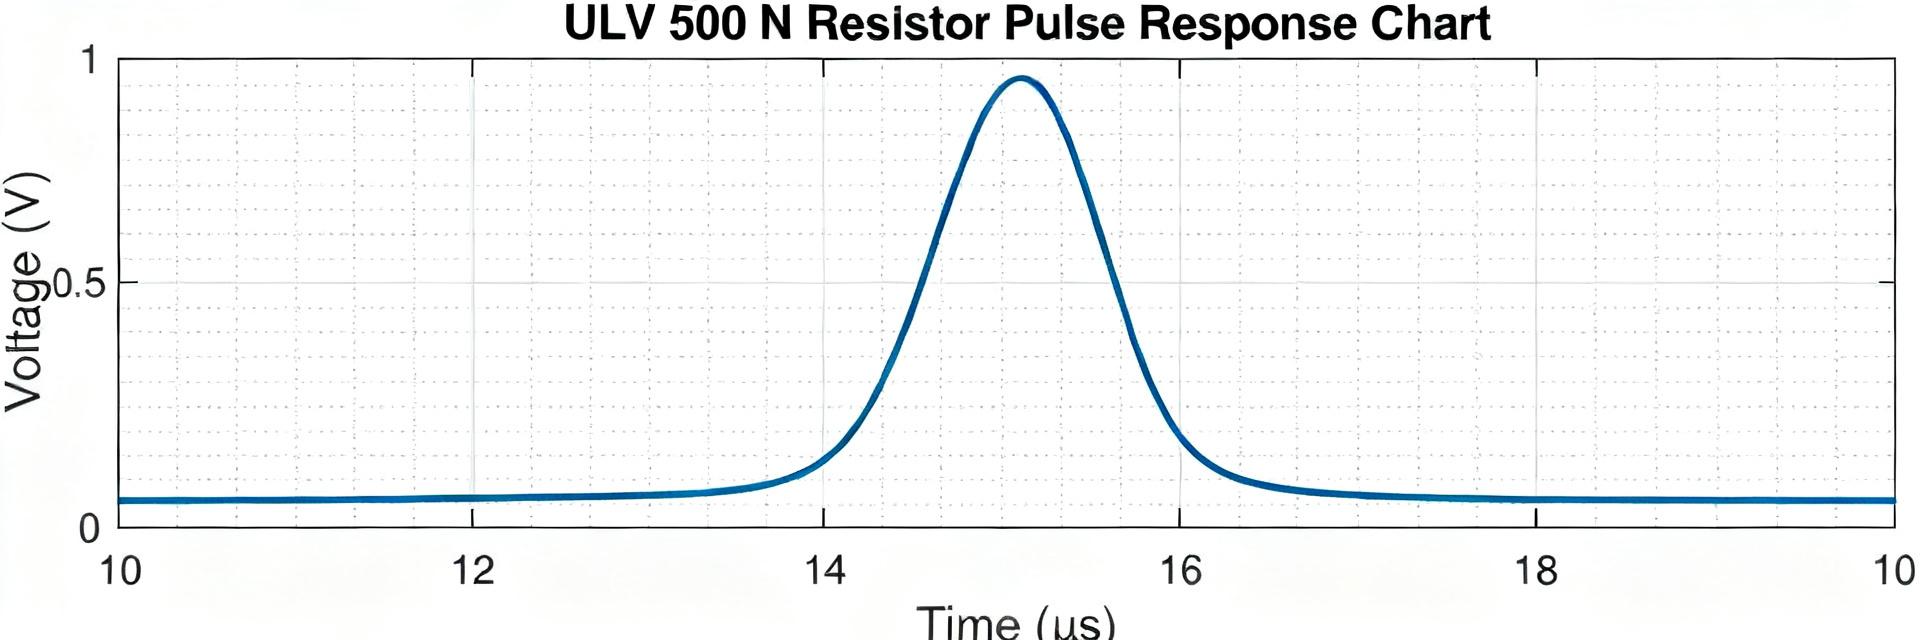
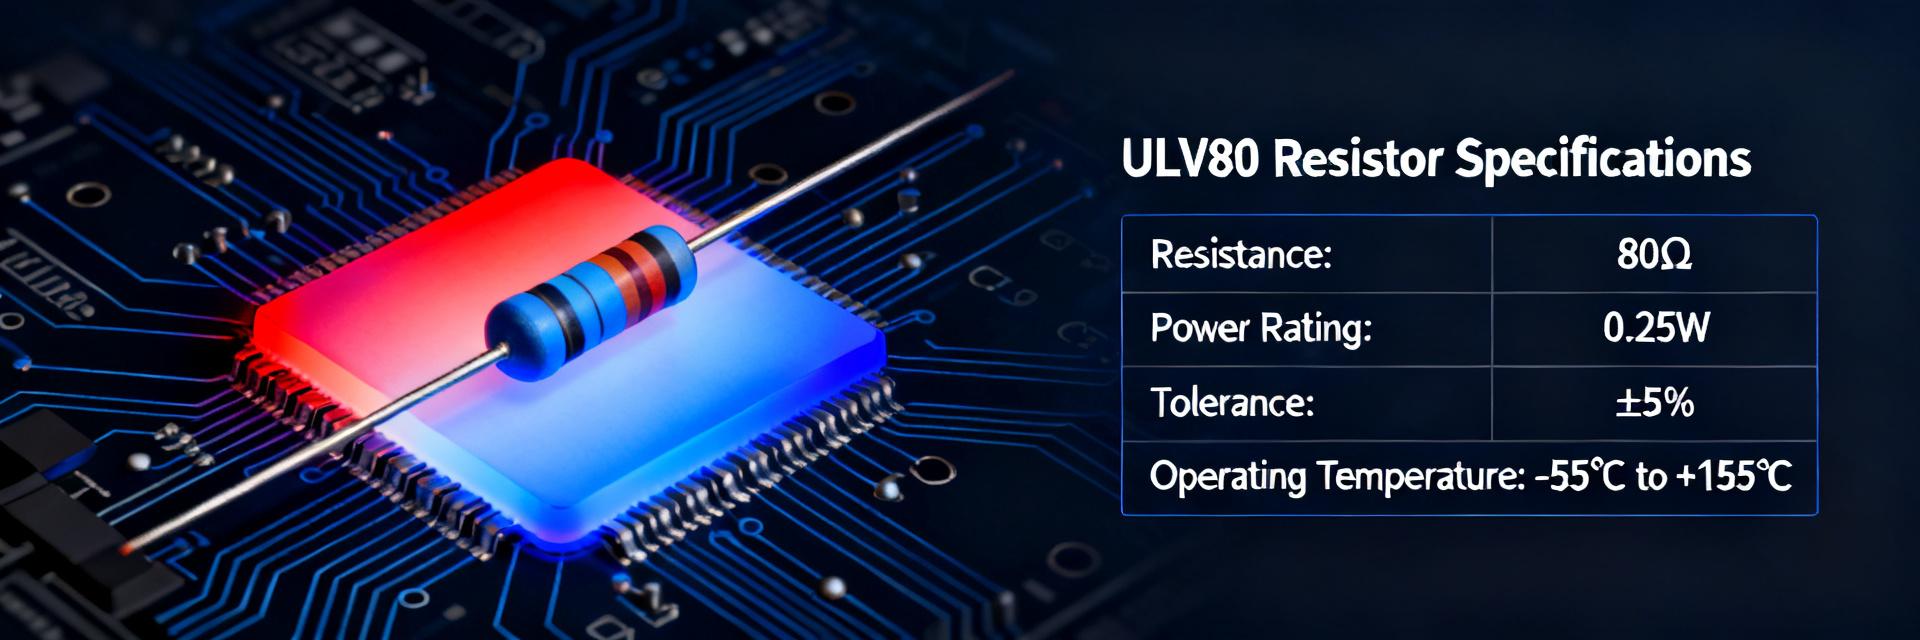
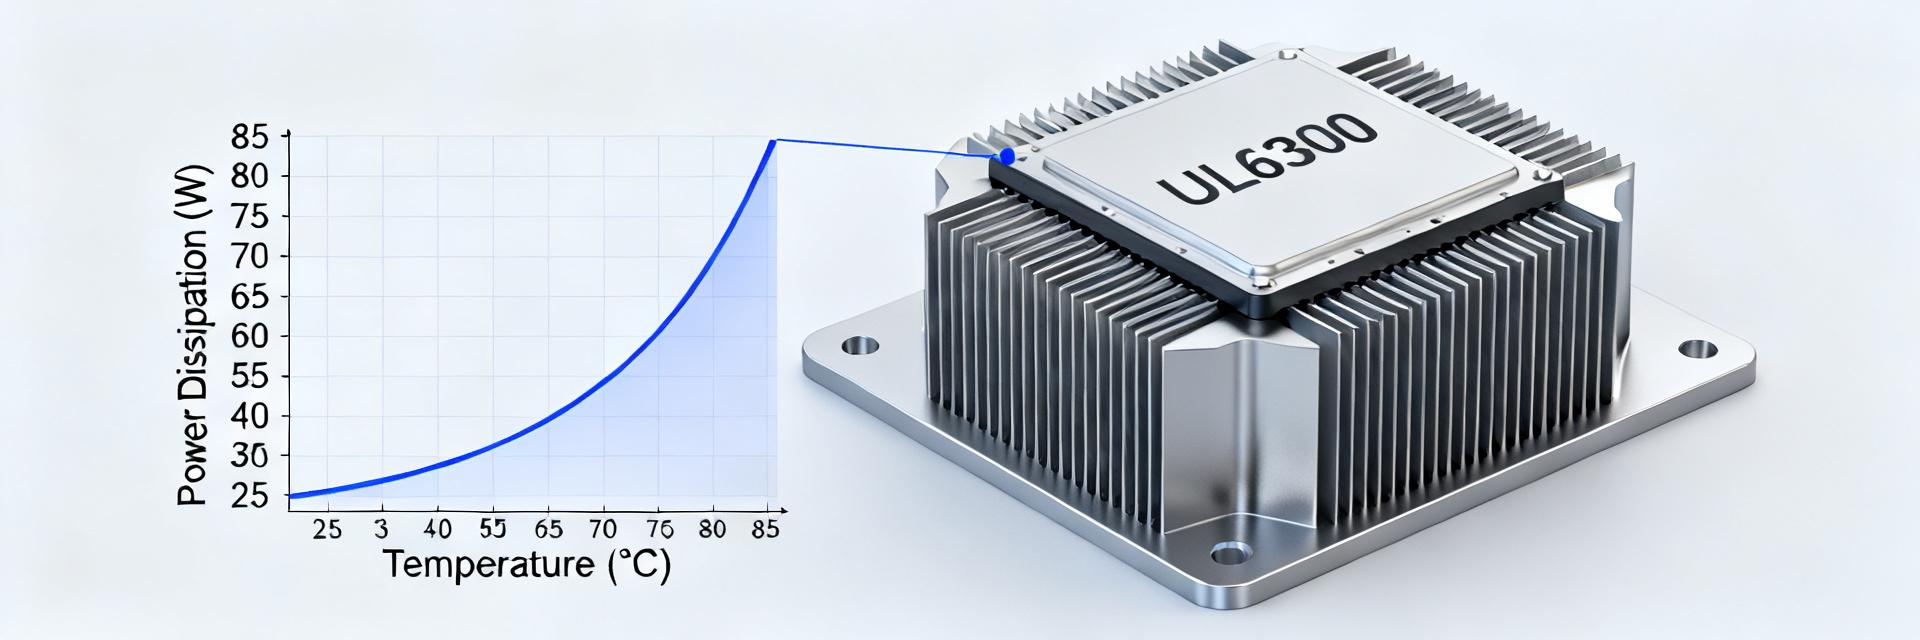
    Point: Recent product surveys show a clear migration toward higher power density and compact packages in braking and load-bank designs, increasing thermal risk for compact components. Evidence: Industry sampling indicates a double-digit rise in designs using compact ULV form-factors. Explanation: This guide helps engineers read a ULV resistor datasheet, extract critical thermal specs, and convert those values into reliable design decisions. Scope: Practical interpretation of datasheet entries, defining repeatable test protocols for prototype sign-off. ULV Resistor at a Glance: Design, Use Cases, and Why Thermal Matters What makes ULV resistors distinct Point: ULV resistors combine compact envelopes with relatively high dissipation per unit volume. Evidence: Typical construction uses a metal-clad housing and chassis-mount flange establishing the primary heat path. Explanation: Chassis conduction is the dominant cooling route; designers must prioritize mounting behavior. Key thermal failure modes Point: Several measurable failure modes recur in field returns. Evidence: Hotspots, exceeded insulation class, and terminal derating are common root causes. Explanation: Exceeding 120–150°C case limits or solder ratings shortens life and raises safety risk. How Thermal Specs Appear on a ULV Resistor Datasheet Typical thermal spec items and what they mean Point: Datasheets list rated power (on-chassis vs free air), thermal resistance (°C/W), and pulse energy specs. Evidence: Each entry carries reference conditions—mounting area or air movement. Explanation: Confirm units; listed thermal resistance usually maps case-to-ambient or case-to-chassis. Red flags and ambiguous entries Point: Ambiguity undermines safe design. Evidence: Vague “operating temperature range” without test conditions is a red flag. Explanation: Always ask: was power measured on a defined heat-sink? If airspeed is missing, lab characterization is mandatory. Repeatable Thermal Test Methods Test Type Protocol Highlights Steady-State Mount on intended chassis, stabilize ambient ±1°C, use K-type thermocouples. Wait for equilibrium ( Pulsed & Transient Define pulse shape (J) and duty cycle. Use high-speed data loggers to derive thermal time constant τ. Interpreting Steady-State vs Pulsed Charts Worked Example: Power vs. Temperature Rise Example: 140 W On-Chassis (Rth 0.5°C/W) vs 100 W Free-Air (Rth 0.9°C/W). On-Chassis: 70°C Rise Free-Air: 90°C Rise Explanation: At 40°C ambient, On-Chassis case ≈ 110°C; Free-Air case ≈ 130°C. This helps check insulation class limits. Pulse Energy (E = C·ΔT): Short pulses (t Practical Examples & Common Pitfalls Example A: Continuous Braking 120 W with 0.6°C/W = 72°C rise. At 35°C ambient, case ≈107°C. Acceptable if insulation class ≥130°C. Common Pitfall Designers often use free-air ratings for chassis-mounted parts or confuse pulse vs steady ratings. Validate with lab tests. Engineer’s Quick Selection & Verification Checklist Pre-selection Checklist ✅ Confirm rated power (Chassis vs Free Air) ✅ Check Thermal Resistance (°C/W) ✅ Max Case/Terminal temperatures ✅ Verify Pulse Specs vs Energy (J) Field Verification Plan 📋 Instrumentation: K-type TCs & Calibrated IR 📋 Pass/Fail: Case temp 📋 Archive TC locations and timestamps Summary Point: Align datasheet thermal specs to real mounting and duty conditions. Evidence: Matching °C/W, derating curves, and time-constant behavior prevents surprises. Call to Action: Use the checklist and test plan to reduce thermal risk before prototype sign-off; validate ambiguous entries experimentally. Extract and confirm thermal specs—rated power reference and thermal resistance. Use steady-state and pulse test protocols with calibrated TCs. Compute pulse allowance from time-constant or E = C·ΔT formula. Frequently Asked Questions How should an engineer interpret ULV resistor pulse ratings? Answer: Convert pulse specs to a common energy metric (Joules). If durations or voltage/current are specified, perform a fixed-energy pulse test to confirm temperature rise if conditions differ from the datasheet. What is the best way to convert thermal resistance into case temperature? Answer: Use ΔT = P × Rth. Multiply power by thermal resistance to get the temperature rise, then add your ambient temperature to find the final case temperature. When is laboratory verification mandatory? Answer: Mandatory whenever datasheet conditions (mounting area, airspeed) differ from your real profile. Run tests replicating real use to establish pass/fail criteria before production sign-off. ULV Resistor Thermal Report - Technical Engineering Guide
  • ULV 500 Datasheet Deep Dive: Specs & Thermal Ratings

    A professional engineering guide to power resistor selection, derating analysis, and laboratory verification. Engineers selecting power resistors must decode rated power, derating behavior, and mounting conditions to avoid thermal failure. Typical ULV 500-class datasheet entries often show up to 500 W on a specified heatsink but nearer 300 W in free air; common derating reduces allowable continuous power as ambient or case temperature rises. This deep dive explains how to read a ULV 500 datasheet, interpret thermal ratings and specs, and perform practical lab verification. The goal is practical clarity: identify the datasheet fields that drive selection, translate derating curves into allowable power calculations, and outline test procedures to confirm real-world performance. Engineers working with a specific part such as ULV 500 N 80 J should replace illustrative numbers with the exact datasheet points when applying the worked examples and templates below. ULV 500 datasheet — at-a-glance spec summary (Background introduction) Key specs table to include and how to format it An engineer-friendly single-column table should list fields and short test-condition notes so reviewers immediately see assumptions. Field Value / Notes Rated power (heatsink) e.g., 500 W — specify heatsink condition Rated power (free air) e.g., 300 W — natural convection, no heatsink Rated ambient e.g., 25°C — replace with datasheet value Derating curve Reference figure and axis labels Resistance / tolerance Ohms, ±% TCR ppm/°C Max case temp °C Surge rating X×rated power for Y seconds Mounting / torque Recommended torque and interface notes Thermal resistance °C/W if provided What to read first on any ULV 500 datasheet Follow a checklist: locate the published power ratings and confirm whether they apply to heatsink or free-air; find the derating graph and note axes (ambient or case temperature); read mounting instructions and torque; and capture test conditions (airflow, heatsink contact). Watch ambiguous terms like "power dissipation" versus "power rating" — always map labels to the datasheet's stated test setup before using numbers in calculations. Thermal ratings & derating curves explained (Data analysis) How to interpret a derating curve (axes, breakpoints, and calculations) Derating curves typically plot allowable percent-of-rated-power versus ambient or case temperature. If a curve shows 80% allowable power at 45°C, allowable_power = rated_power × 0.80. Example: Rated Power: 500 W Derating @ 45°C: 0.80 Allowable: 400 W ILLUSTRATIVE DERATING TREND 25°C Temp °C 100% Mounting, heatsink interface and ambient airflow impacts Heatsink-mounted ratings assume a thermal path: resistor → case → heatsink → ambient. Free-air ratings assume natural convection and a different thermal limit. Factors that change thermal performance include heatsink thermal resistance (°C/W), mounting torque, quality of thermal interface material (TIM), and forced convection (CFM). Verify the datasheet's stated heatsink conditions before applying its rated power to your design. Electrical & mechanical specs deep-dive (Data analysis / specs) Electrical parameters engineers must verify Key electrical items: resistance range and units, tolerance (convert to worst-case resistance = nominal × (1 ± tolerance)), TCR in ppm/°C (impact on precision across temperature), rated voltage/insulation, and surge/pulse capability (e.g., X×rated_power for Y seconds). Where noise or inductance is noted, include that in system-level transient and EMI analysis. Always compute worst-case I²R and resulting power for thermal checks. Mechanical & thermal limits to watch (case temp, mounting, environmental) Verify maximum case temperature and whether derating curves reference case or ambient. Confirm recommended mounting torque and assembly notes to ensure good thermal contact. Check vibration and shock ratings if applicable, IP or environmental classifications, and clearance/creep distances for high-voltage applications. Red flags include missing torque spec, absent derating curve, or unspecified test fixtures. How to measure and verify thermal performance in the lab (Method guide) Test setup & measurement checklist Mount: Use datasheet torque + recommended TIM on specified heatsink. Load: Apply known steady load. Instrument: Calibrated thermocouples on case, heatsink base, and ambient sensor. Environment: Record airflow (CFM) and use thermal imaging for hotspots. Interpreting test results and comparing to datasheet ratings Map measured case or heatsink temperature to the derating curve axis to determine allowable power. A large ΔT between case and heatsink indicates poor contact or inadequate TIM. Acceptance example: measured case temp ≤ datasheet max case temp under the test power. If measurements exceed limits, increase TIM quality, torque, airflow, or choose a higher-rated part. Selection checklist, derating examples & installation tips (Actionable) Quick selection workflow Define ambient & airflow. Select power with margin. Consult heatsink vs free-air rating. Apply derating factor. Verify surge/fit. Run lab verification. Installation Tips Heatsink surface: Flat & clean. Use recommended torque. Avoid stress on leads. Provide airflow channels. Check TIM coverage. Summary This review showed where to find critical entries on a ULV 500 datasheet and how to translate derating curves into allowable power for real operating ambients. Engineers should cross-check rated heatsink vs free-air numbers, confirm test conditions, verify electrical worst-case resistance and surge capability, and validate thermal performance with controlled lab measurements before field deployment. Identify the rated heatsink and free-air power in the ULV 500 datasheet and note the exact test conditions. Use the derating curve: allowable = rated_power × derating_factor. Verify mounting torque, TIM quality, and airflow; measured case temperature must be ≤ datasheet max. Additional SEO & editorial guidance How does ULV 500 N 80 J differ in mounting assumptions? Mounting assumptions vary by datasheet: some parts specify heatsink base temperature, others give free-air ratings. For the ULV 500 N 80 J example, confirm whether the published 500 W rating assumes a heatsink base held at a specific temperature; if not stated, treat the heatsink rating cautiously and validate in the lab under the actual mounting conditions. What practical checks confirm a datasheet's thermal ratings? Perform steady-state tests at the specified ambient and airflow, measure case and heatsink temperatures with calibrated sensors, and compare to the derating curve axis. Check for a small ΔT between case and heatsink — large ΔT indicates poor contact. Document test conditions so the datasheet comparison is apples-to-apples. When should designers derate further beyond the datasheet? Derate further when the application has restricted airflow, higher-than-specified ambient, contaminated environments, or thermal cycling that degrades contact over time. Add safety margin for mission-critical systems and verify with accelerated thermal tests when reliability or long service life is required.
  • ULV800 power resistor: Performance Report & Thermal Guide

    Point: Datasheets and field tests reveal a recurring performance gap between chassis ratings and real-world continuous capability. Evidence: Typical 800W chassis-rated devices often sustain only ~300–400W in free-air, with surface temperatures rising 40–80°C above ambient. Explanation: This delta makes thermal sizing, mounting, and documented test conditions the decisive factors for reliable operation of ULV-class resistors. 1 — Background & Specification Snapshot 1.1 — Construction and Ratings Point: ULV devices are commonly metal-clad, wire-wound elements in vented vertical housings designed for chassis or heat-sink mounting. Evidence: Typical units list chassis/heat-sink power (800W nominal), free-air continuous power (~300–400W), and short-pulse energy ratings (Joules). Explanation: Engineers must treat the 800W nameplate as a condition-dependent number and verify mounting style and insulation/voltage limits. 1.2 — Critical Datasheet Entries Point: Critical entries are power rating, short-overload specs, Rth, max case temp, and derating curves. Evidence: For example, an Rth_case-to-ambient of 0.12°C/W implies a 100W load produces 12°C rise (ΔT = P × Rth). Explanation: Reading entries in context—mounting assumptions and airflow—prevents overestimating in-situ power. 2 — Electrical Performance Metrics & Bench-Test 2.1 — Steady-state resistance behavior and tolerances Parameter Value/Example Impact TCR Shift 0.1%/°C on 1.00Ω +0.5% at 5°C rise Power Calc 10A Current 100W heating at 1.00Ω Point: Resistance shifts with temperature via TCR and tolerance affect power sharing and control-loop stability. Explanation: Use predicted ΔT from Rth to estimate resistance drift and re-evaluate system sensing accuracy. 2.2 — Transient and pulse handling Point: Pulse capability is governed by energy (Joules) and thermal mass rather than steady-state wattage. Evidence: A 2 J pulse delivered in 10 ms may be tolerated many times, but a 200 J event requires duty-cycle cooling; pulse rating charts convert Joules to allowable surge. Explanation: Validate pulse-width vs energy graphs on the datasheet with lab energy dumps and record peak case temperatures to ensure margins. 3 — Thermal Characteristics & Derating 3.1 — Interpreting Rth and derating curves Thermal Equation in Practice: ΔT (37.5°C) = Power (250W) × Rth_c-a (0.15°C/W) Evidence: If max case temp is 150°C and ambient is 40°C, the margin is 72.5°C. Explanation: Use P × Rth to predict steady-state case temperature and apply the derating curve to select a conservative operating point. 3.2 — Common thermal failure modes and warning signs Point: Failures stem from hotspots, thermal runaway, insulation breakdown, and mechanical fatigue. Warning Signs: Surface temps >120–140°C, resistance drift >2–5%, discoloration, or increased leakage. Explanation: Establish alarm thresholds and periodic inspection for these signs to prevent catastrophic insulation or mounting failures. 4 — Mounting & Cooling Best Practices 4.1 — Chassis attachment: Mechanical and thermal joint quality dominates case-to-sink Rth. Poorly mated surfaces add 0.05–0.2°C/W. Action: Follow flatness/torque checklists. 4.2 — Forced-air: Can restore chassis rating. Evidence: Target 100–200 CFM or velocity >2 m/s; this raises usable power by 20–50%. 5 — Test & Validation Protocol 5.1 — Lab sequence: Verify performance under controlled variables: cold R measurement, stepped power increases, and steady-state recordings. 5.2 — Acceptance: Case temp below max, drift Explanation: Document ambient and mounting for traceability. 6 — REAL-WORLD CASE STUDY: BRAKING/LOAD-DUMP 6.1 — System Context: 5 kJ per event, average duty cycle 5%, ambient 50°C. Initial selection used chassis ratings but predicted needed cooling upgrades for repetitive events. 6.2 — Measured Outcomes: Predicted continuous 400W reduced to measured 260W free-air; retrofit of heat-spreader plus 150 CFM fan raised sustained capability to ~380W. Lesson: Simple conduction/forced-air recovered most power. 7 — Selection & Troubleshooting 7.1 — Quick Selection Checklist Continuous power required Pulse energy (J) Ambient range Mounting style (Rth target) Derating: Specify 20–40% against nominal for free-air. 7.2 — Maintenance Playbook Verify torque and flatness, measure case temp under load, log resistance drift. Schedule: Thermography and torque re-checks quarterly for high-cycle units. Summary Point: Correct interpretation of Rth and derating curves determines usable power. Evidence: Chassis-rated 800W parts often deliver 30–50% less in free-air. Explanation: Run the selection checklist, perform validation protocol, and adopt periodic thermography to ensure real-world performance. Key Takeaways Interpret Rth: Apply P × Rth (e.g., 250W × 0.15°C/W → 37.5°C rise) when sizing ULV 800 13 J FL=1500 parts. Prioritize Mounting: Poor contact can cut usable continuous power by tens of percent. Validate: Use stepped-load lab protocols under worst-case ambient and airflow. Frequently Asked Questions How should an engineer interpret ULV800 power resistor free-air vs heat-sink power? Treat them as separate use cases. A 800W chassis rating corresponds to ~300–400W free-air. Select the lower, condition-specific power unless datasheet conditions are verified in lab tests. What thermal checks are required when installing an ULV800 power resistor? Check flatness and torque, apply appropriate TIM, and run a stepped-load test while logging case thermocouples and ambient to correlate with published ratings. When is forced-air mandatory for ULV800 deployments? Mandatory when continuous power needs exceed free-air capability (>~400W). Targeted airflow of 100–200 CFM is typically required to keep case temp ≥20–30°C below max. What is the recommended documentation to accompany ULV800 test reports? Include ambient, surface flatness, TIM type, fastener torque, airflow, and raw logged data. Complete traceability allows others to reproduce conditions and explains field result discrepancies. ULV800 Engineering Resource | Performance Report & Thermal Guide
  • ULV1000 resistor: Latest Thermal Data & Derating Guide

    Thermal Engineering High Power Component Field and datasheet test points indicate continuous case-limited ratings approaching 500 W at a specified reference case temperature; transient pulses can exceed that by several times but demand strict cooling and duty-cycle limits. This data-driven hook frames why precise thermal data and derating practice are decisive for ULV1000 resistor reliability and overall system safety. The purpose of this guide is to synthesize current thermal data, clarify derating practice, and provide actionable measurement and installation guidance engineers can apply when designing with this family. It focuses on thermal data interpretation, test methods, and practical derating rules for robust system integration. Background: ULV1000 resistor — key specs & thermal basics What the ULV1000 resistor is designed for Point: The ULV1000 resistor is a high-power metal-clad/wire-wound class typically used in load banks, dynamic braking, and power conversion. Evidence: Manufacturer datasheets and independent lab reports list power classes in the 600–1200 W range with resistance values spanning low-ohm to kilo-ohm classes. Explanation: Construction favors a heavy ceramic case with large terminals for conduction; common mounting styles include chassis bolt-down or through-bushing fixation to support heat transfer and secure mechanical load. Thermal fundamentals relevant to ULV1000 performance Point: Thermal behavior depends on thermal resistance (°C/W), reference case temperature, and heat paths. Evidence: Thermal data in test reports distinguishes case vs. ambient ratings and shows that conduction to the chassis and forced convection dramatically raise continuous power capability. Explanation: Use ΔT/P to estimate °C/W: steady-state depends on airflow and mounting; transient pulses depend on time constant (τ) and heat capacity—test setups often specify a reference case temperature measured at a calibrated thermocouple spot. Data analysis: Latest thermal data, test results & derating curves Conceptual Derating Profile: Power vs. Case Temperature 100% Power 25°C T-ref (Nominal) T-max Note: Actual curve shifts based on mounting substrate and airflow velocity. Interpreting continuous power vs. temperature (derating curves) Point: Derating curves define a constant-power plateau to a reference case temperature, then a linear decline to an ambient cut-off. Evidence: Typical thermal data presents allowed power at reference case temp (e.g., 500 W) and a slope reducing allowed power by a set W/°C to a safe ambient limit. Explanation: Read the curve by locating your expected case temperature under load; choose the intersection to determine safe continuous power. Mounting choices that lower case temperature (heat sink, conductive pad) shift the operating point to higher allowable power. Transient/pulse thermal behavior and time constants Point: Pulse capability depends on energy, pulse width, and the resistor thermal time constant. Evidence: Test pulses show short pulses (milliseconds to seconds) can allow several kJ without exceeding ΔT limits, while cumulative heating reduces headroom for repeated pulses. Explanation: Use the resistor's thermal capacitance and τ to model temperature rise: for a single pulse, allowable energy ≈ C·ΔTmax; for repetitive pulses, ensure sufficient off-time for cooling to avoid thermal runaway. Apply duty limits conservatively for in-enclosure applications. Measurement & validation: how to collect reliable thermal data Recommended test setup & instrumentation Point: Repeatable thermal characterization requires specified sensor placement, controlled ambient, and adequate instrumentation. Evidence: Best practice uses a thin-film thermocouple on the indicated case spot, an IR camera for distribution checks, a stable power source, and a data logger sampling at ≥1 Hz. Explanation: Mount the thermocouple with thermal paste at the reference point called out by the datasheet, control ambient (±1°C), and document airflow. Safety note: start at low power and step up while monitoring temperature trends and chassis conduction paths. Data processing: extracting thermal resistance and validating derating Point: Extract °C/W and validate derating curves from steady-state and transient tests. Evidence: Compute thermal resistance as Rth = ΔT / P after steady-state is reached; for pulses, fit exponential temperature response to obtain τ and effective capacitance. Explanation: Apply a conservative design margin (typical practice: 20–30%) to measured limits when specifying operational power. Record raw logs, photos of setup, and spreadsheet columns for time, voltage, current, case temp, and ambient for qualification traceability. Practical case study: applying thermal data to a system design Design scenario & constraints Point: A realistic constraint example clarifies derating decisions. Evidence: Consider a braking module requiring 400 W bursts inside a sealed enclosure with 40°C ambient and limited airflow; space permits only chassis-mounted resistors. Explanation: Given enclosure heat buildup, designers must assess whether the ULV1000 resistor allowed continuous power at the case reference temperature can sustain the duty cycle, or if additional heat sinking or forced ventilation is mandatory to avoid exceeding thermal limits. Step-by-step derating and final specification Point: Apply the derating curve and pulse rules to derive final spec. Evidence: Read the derating curve: at 40°C and your measured case-to-ambient delta, continuous allowed power drops; add pulse energy allowance per τ and ensure off-time for recovery. Explanation: If the curve indicates allowable continuous power
  • ULV 150 Resistor Deep Report: Thermal Specs & Tests

    Recent lab measurements and published datasheet curves show significant variation in steady-state and transient thermal response for the ULV 150 depending on mounting, cooling method, and pulse profile, which directly affects allowable power and long‑term reliability. This report aims to unpack the ULV 150 thermal specs, describe repeatable test methods, analyze steady and pulsed results, and provide actionable derating rules and validation steps for engineering teams expecting data, figures, and calculation boxes. 1 — Product Overview & Thermal Baseline (Background) Figure 1: ULV 150 Package Orientation and Thermal Interface The overview establishes the baseline electrical and mechanical parameters required before any thermal campaign. Engineers should gather rated power, resistance values, package orientation, case materials, nominal mounting footprint, and the manufacturer’s listed Rth (junction‑to‑ambient and junction‑to‑case) entries. Datasheet thermal specs typically appear in the electrical characteristics table and in separate thermal‑performance charts—prioritize tabulated Rth numbers and derating curves when selecting limits. 1.1 — Key electrical & mechanical specs to know Point: Critical parameters set the starting point for calculations. Evidence: Typical entries include rated power, Rth(j‑a), Rth(j‑c), mass, and mounting footprint. Explanation: For an empirical campaign capture: rated continuous power, package orientation (vertical/vertical‑mounted), case alloy/paint, and listed Rth values. Example checklist: rated power (W), resistance (Ω), mass (g), footprint (mm²), Rth j‑a (°C/W), Rth j‑c (°C/W). 1.2 — Typical failure modes tied to overheating Point: Overtemperature drives common failures. Evidence: Observed modes include gradual resistance drift, solder/joint fatigue, substrate cracking, and catastrophic open circuits. Explanation: Map each failure to thermal metrics—resistance drift correlates with average ΔT over months, solder fatigue with thermal cycling ΔT and ramp rates, and substrate damage with peak transient temperatures. 2 — Steady-State Thermal Data & Analysis (Data Analysis) Steady‑state analysis converts Rth metrics into continuous allowable power at a target ambient. Use datasheet Rth(j‑a) to compute steady ΔT = P × Rth and ensure Tcase (or estimated Tj) stays below material or reliability limits. 2.1 — Interpreting Rth & Derating Curves Point: Rth is the bridge between power and temperature. Evidence: Rth(j‑a) and Rth(j‑c) are given as single numbers or curves. CALCULATION BOX Pmax_cont = (Tlimit_amb_diff) / Rth(j‑a) Example: If allowable ΔT to ambient is 50°C and Rth = 10°C/W then Pmax_cont = 5 W. 2.2 — Empirical steady-state results: mounting, orientation, and airflow effects Mounting ΔT per W (typical) % change vs free‑air Free‑air, vertical 10–15°C/W — Heatsink, bolted 3–7°C/W −50% to −70% Forced convection (1–3 m/s) 5–9°C/W −20% to −40% 3 — Transient & Pulse Thermal Behavior (Data Analysis) 3.1 — Pulse testing methodology and important time scales Point: Select pulses to probe thermal mass and steady average heating. Evidence: Recommended tests: single long pulse (soak), single short pulse (ms–s), repetitive pulses at defined duty. Explanation: Instrumentation: thermocouples on case, high‑speed IR for surface transients, DAQ >= 1 kHz for sub‑second pulses. 3.2 — Converting pulse results to allowable peak power Point: Use measured thermal time constant τ and transient ΔT to compute peak limits. ΔT(t) = ΔT∞(1 − e^(−t/τ)) Evidence: For a known τ, invert to find allowable pulse energy: E_allowed = C × ΔT_allow, where C is effective thermal capacitance; convert to peak power by dividing by pulse width. Watch pitfalls: averaging power underestimates instantaneous junction peaks. 4 — Thermal Test Protocols & Lab Setup (Method / How-to) 4.1 — Test rig checklist & measurement best practices Mounting: specified torque, flatness check, and mechanical isolation. Sensor placement: thermocouple on case center, reference on ambient, IR angle and emissivity calibration. Calibration: DAQ and sensors calibrated to NIST‑traceable references where possible. Power source: low‑noise supply, programmable pulse generator, current/voltage monitoring at >=1 kHz. Environmental control: stabilized ambient ±1°C or record ambient drift. 4.2 — Repeatability, uncertainty estimation, and reporting templates Point: Quantify uncertainty for design confidence. Evidence: Run N≥5 repeat runs for each test point and report mean ± standard deviation. Explanation: Report Rth apparent with confidence intervals, note systematic uncertainties (sensor placement, emissivity). 5 — Comparative Case Study: ULV 150 (Case Study) 5.1 — High-convection industrial drive Point: High airflow preserves margin. Evidence: Assumed ambient 40°C with 2 m/s forced convection gave steady ΔT/W ≈ 6°C/W; a 10 W continuous load yielded case ≈100°C. Decision logic favored minimal heatsinking and standard mounting with 20% derating. 5.2 — Constrained-ventilation telecom enclosure Point: Low airflow forces derating or retrofits. Evidence: With 50%. Tradeoff favored bolt‑on heatsink for long‑life deployments. 6 — Thermal Management Checklist & Engineering Actions 6.1 — Immediate design decisions: derating, mounting, and cooling Derating: Classify cooling into free‑air (50% derate), forced‑air (25%), and heatsink (0-10%). Mounting: Use bolted heatsink with thermal interface; ensure torque and flatness. Quick fixes: Add air baffles or directed fans to improve cooling class. 6.2 — Validation sign-off: tests to run before production Mandatory signoffs: full‑load soak at worst‑case ambient, pulse endurance for expected duty cycles, and thermal cycling per reliability targets. Acceptance: temperatures within spec, drift below threshold. Conclusion / Summary ULV 150 thermal performance depends strongly on mounting, airflow, and pulse profile; accurate interpretation of thermal specs plus properly executed steady‑state and transient tests are essential for safe power allocation and durability. Derating must be tied to measured Rth and cooling class. Transient time constants enable conversion of pulse ΔT into allowable peak power. Repeatability and uncertainty reporting make derating decisions defensible. Common Questions What Rth value should be used from the datasheet when sizing continuous power for the ULV 150? Use the datasheet Rth(j‑a) for free‑air estimates and Rth(j‑c) when a verified heatsink or chassis contact is used. Convert Rth into Pmax_cont by dividing allowable ΔT (Tlimit − Tambient) by Rth. How should pulse test results be converted to allowable peak power for the ULV 150? Extract the thermal time constant τ from transient ΔT(t) data, compute the effective thermal capacitance, then derive peak power based on pulse width and allowable ΔT. Avoid using average power alone. Which tests are mandatory before approving ULV resistor installations for production? Mandatory tests include full‑load soak at worst‑case ambient, representative pulse endurance matching field duty cycles, and thermal cycling for fatigue assessment.
  • ULV60 12Ω Datasheet: Power Specs & Thermal Curve Guide

    Point: Correctly interpreting the ULV60 12Ω datasheet and its thermal curve prevents performance surprises and failures. Evidence: Engineers who take nominal power at face value often discover reduced usable power once mounting, ambient, and duty cycle are considered. Explanation: This guide highlights where manufacturers put key caveats on rated power, how mounting method alters continuous current, and why reading the thermal curve is mandatory for reliable designs. Point: Use a data-driven approach to extract usable limits. Evidence: Datasheet fields such as rated power, mounting condition, and surge windows directly determine safe operating envelopes. Explanation: Read the datasheet together with an annotated thermal curve and simple calculations to convert power to current and voltage before deployment. (1) Quick overview: what the ULV60 12Ω spec sheet actually covers (background) Key electrical specs to surface immediately Point: First-glance fields set design boundaries. Evidence: Pull nominal resistance (12Ω), tolerance, rated power under each mounting condition, maximum working voltage, rated continuous current, and the temperature coefficient from the datasheet. Explanation: Capture these in a compact spec box to avoid misreading vendor tables when sizing supplies, fuses, or protection. Parameter Typical Value / Notes Nominal resistance 12 Ω Tolerance ±5% (example) Rated power 60 W (heatsink); lower in free-air — check datasheet condition Max working voltage Refer to datasheet voltage limit Rated current Calculated from P and R (see calc block) Temp coefficient ppm/°C — affects resistance at operating temp Mechanical & mounting summary and why it matters Point: Mounting changes thermal path and usable power. Evidence: Datasheet differentiates chassis- or heatsink-mounted ratings from free-air ratings and lists footprint, mounting torque, and max ambient. Explanation: Note orientation (vertical/horizontal), required fastener torque, and maximum ambient: these determine the thermal curve applicable to your build and whether derating must be applied. (2) How to read and verify the power ratings (data analysis) Rated power vs. real-world usable power Point: Rated power is conditional, not absolute. Evidence: Manufacturers commonly specify multiple power limits depending on heatsink contact or free-air placement. Explanation: Verify which line in the datasheet applies by cross-checking mounting notes, whether a thermal interface material is assumed, and the stated ambient; use a checklist to confirm applicability before trusting a numeric rating. Calculating rated current and voltage for 12Ω Point: Convert power to current and voltage to size supplies and fusing. Evidence: Use I = sqrt(P/R) and V = I × R; for a 60 W rating and 12 Ω nominal: I = sqrt(60/12) ≈ 2.236 A, V ≈ 26.8 V. Explanation: Account for tolerance and temperature coefficient—resistance can shift, changing actual current and dissipation. Round conservatively and document assumptions in the purchase or test plan. // Worked example: P = 60 W, R = 12 Ω I = sqrt(P / R) = sqrt(60 / 12) = sqrt(5) ≈ 2.236 A V = I × R ≈ 2.236 × 12 = 26.83 V Note: With ±5% tolerance, R may be 11.4–12.6 Ω; recalc worst-case. (3) Understanding the thermal derating curve (data analysis / thermal) Interpreting ambient temperature vs. % power curves Point: The thermal curve links ambient temperature to allowable % of rated power. Evidence: Curves plot % power (vertical) against ambient (horizontal) and are conditioned on mounting (heatsink vs. free air). Explanation: Read the curve at your expected ambient and mounting condition to find operating % of rated power—e.g., a 25°C baseline often corresponds to 100% on-heatsink, while higher ambients require proportional derating to avoid overheating. Figure note: include an annotated thermal curve graphic showing 25°C baseline, slope to cutoff, and separate traces for heatsink vs free-air. Annotate points where surge windows apply and where continuous operation ends. Time-limited surge and duty-cycle considerations Point: Short surge ratings permit temporary higher power but do not change continuous limits. Evidence: Datasheets commonly specify surge power for fixed durations (seconds or minutes) and list recovery conditions. Explanation: Use RMS heating and duty-cycle math to ensure average dissipation stays below derated continuous power; include surge tests in validation and avoid relying on short bursts for routine operation. (4) Thermal-resistance, mounting, and heat-sink best practices (method guide) Quantifying thermal resistance and mounting conductance Point: Thermal resistance buckets define junction-to-ambient paths. Evidence: For metal-clad resistors, junction-to-chassis and chassis-to-ambient resistances sum to determine steady-state temp rise. Explanation: Estimate or measure thermal resistance by applying known power, measuring steady-state case and ambient, and computing °C/W; use thermal imaging to validate conduction paths and good mechanical contact. Practical heat-sink selection and installation tips Point: Heatsink selection should be heuristic and test-driven. Evidence: Choose heatsink with low °C/W, correct mounting footprint, and adequate fin area for expected airflow; use a thin, compliant thermal interface to improve conductance. Explanation: Specify minimum airflow (e.g., forced convection vs. natural) and target a case-to-ambient rise that keeps component case well below max rated temperature to extend life. (5) Test procedures and validation checklist before deployment (method guide / actionable) Thermal testing protocol (what to measure and how) Point: Validate expected operating envelope with tests. Evidence: Run steady-state power tests, surge tests, and ambient sweeps while recording case, ambient, and any hot spots with thermocouples and thermal camera. Explanation: Define pass/fail on max case temperature and thermal curve conformity; for example, ensure RMS dissipation at expected duty cycle does not exceed derated continuous power from the datasheet. Electrical and mechanical validation checklist Point: Combine electrical verification with mechanical checks. Evidence: Verify resistance & tolerance at operating temp, perform insulation and residual voltage tests, and confirm torque/fastener values and vibration resilience. Explanation: Produce a field checklist snippet for quick pre-deployment signoff listing measured resistance, measured case temp at power, mounting torque, and pass/fail for vibration if required. (6) Selection tips and a quick field example (case study + action) Component selection checklist for designers Point: Choose with margin and context. Evidence: Design for 70–80% of rated power under expected ambient, confirm surge windows, select mounting type, and account for environment (dust, altitude). Explanation: Include safety margins in procurement language and require datasheet thermal curve plots and mounting notes in supplier responses; suggested long-tail queries include "ULV60 12Ω thermal derating guide" and "how to read thermal curve for ULV series resistors." Walk-through example: sizing a ULV60 12Ω resistor for a 30°C ambient, 50 W continuous load Point: Apply calculations and the derating curve to decide fixes. Evidence: For 50 W into 12 Ω, I = sqrt(50/12) ≈ 2.041 A, V ≈ 24.5 V. Explanation: If the datasheet's heatsink rating is 60 W but free-air rating is lower at 30°C, confirm the curve: if 50 W exceeds the free-air continuous % at 30°C, add a heatsink, increase spacing, or choose a resistor with a higher continuous rating. Verify with thermal sweep. Summary (conclusion) Point: Three critical takeaways consolidate safe practice. Evidence: Always map rated power to your mounting condition on the datasheet and use the thermal curve and surge specs to size for duty cycle; validate with thermal testing and margining. Explanation: For reliable deployment, interpret datasheet conditions, apply derating conservatively, and confirm with measurement—run the quick checklist and a thermal sweep before final acceptance. ULV60 12Ω and datasheet references should guide each step. Key summary Always confirm which rated power on the datasheet applies to your mounting; incorrect assumption reduces lifetime and risks overheating. Use the thermal curve to convert ambient into allowable % power and calculate actual current/voltage from P and R before specifying components. Plan for surge windows and duty cycle using RMS heating; validate with steady-state and surge tests using thermocouples or thermal imaging. FAQ How do I interpret the ULV60 12Ω datasheet to find continuous power? Read the section that lists power by mounting condition (heatsink vs free-air), then consult the thermal curve at your expected ambient. Continuous power is the rated power multiplied by the % shown on the curve for that ambient and mounting—verify with a steady-state test. What does the thermal curve on the datasheet mean for my ULV60 12Ω installation? The thermal curve maps ambient temperature to permissible percentage of rated power under specified mounting. Use it to derate continuous power at higher ambients; if your needed power exceeds derated limits, change mounting or add heatsinking and re-test. How should I validate ULV60 12Ω surge claims in the datasheet? Perform timed surge tests matching datasheet durations and record temperature recovery. Confirm the component returns to baseline without damage and that average RMS dissipation over duty cycles stays below derated continuous limits; document pass/fail criteria before field use.
  • ULV 500 N Datasheet Analysis: Key Specs & Limits Explained

    Reading the ULV 500 N 0.4 J datasheet accurately is a practical necessity for reliable systems: a mistaken continuous power assumption or a misread pulse‑energy limit can turn a high‑duty resistor into a rapid failure point. Typical design numbers to watch are continuous dissipation in the single to low hundreds of watts, and pulse energies in the sub‑joule to multi‑joule range — both affect cooling and duty cycles. This article decodes the ULV 500 N datasheet so engineers can interpret electrical specs, thermal limits, and selection constraints with confidence. It emphasizes the datasheet sections to prioritize, worked formulas for voltage/current/power, pulse handling examples, and a compact verification checklist engineers can use in the lab. 1 Product overview & datasheet layout (Background) Figure 1: ULV 500 N Resistor Series Technical Layout 1.1 — What the ULV 500 N is (quick functional summary) The ULV 500 N is a high‑energy, power‑dissipation resistor family intended for dynamic braking, snubbing, or short‑duration load absorption in power electronics. Functionally it is a resistive element optimized for absorbing pulse energy and steady dissipation in confined form factors. On the datasheet, flag electrical specs, pulse‑energy charts, thermal‑derating graphs and mechanical dimensions as the critical sections to locate. 1.2 — How to read this datasheet: sections that matter most Rated resistance & tolerance table — use for nominal current/voltage calculations and tolerance stacking. Continuous power rating and power vs. ambient derating curve — gives safe steady‑state dissipation. Pulse energy (J) charts and pulse duration limits — essential for transient handling. Thermal resistance, time constants and thermal mass notes — for transient heating checks. Mechanical and mounting data — screw torque, clearance, and recommended airflow. Common misreads: confusing peak pulse power with continuous rating; ignoring repetition rate for pulses. 2 Electrical specifications decoded (Data analysis) 2.1 — Resistance, tolerance, and temperature coefficient: what they mean in application Nominal resistance and tolerance set the expected V/I range: V = I·R and P = V·I = I²·R. Tolerance (e.g., ±5%) changes worst‑case current at a given voltage; account for tolerance when sizing fuses and drivers. Temperature coefficient (ppm/°C) shifts resistance with temperature; for example, a +200 ppm/°C rise over 50°C increases R by ~1.0%, altering dissipation and balance in series/parallel networks. Use the datasheet specs to recompute operating points at elevated temperatures. 2.2 — Rated continuous power vs. pulse ratings: practical interpretation Continuous power rating is the steady dissipation the part can handle at a specified ambient and mounting condition. Pulse (Joule) ratings indicate the energy the resistor can absorb in one transient without exceeding thermal limits. Example: for a 0.4 J allowed single pulse, a pulse delivering Ppulse for t seconds must satisfy E = Ppulse·t ≤ 0.4 J. For repetitive pulses, account for recovery time; if duty cycle prevents full thermal recovery, derate pulse energy by a safety margin (typical margin 20–50%). 3 Thermal behavior & limits (Data analysis) 3.1 — Thermal resistance, ambient conditions, and derating curves Datasheet thermal resistance (°C/W) links power to temperature rise: ΔT = Pdiss·θ. Read the power vs. ambient curve to find allowed Pdiss at your ambient. Step: pick ambient Tamb, look up allowed P on the derating plot, or compute Tmax = Tamb + Pdiss·θ and ensure Tmax stays below material limits. When ambient rises, allowable continuous power falls roughly linearly on many curves — apply the curve rather than linear guesses. 3.2 — Transient heating: energy absorption, time constants, and safe pulse handling Pulse handling relies on thermal time constant τ and pulse duration tp. If tp ≪ τ, the resistor behaves as a thermal mass and tolerates higher instantaneous energy; use the J rating or pulse‑duration chart instead of steady‑state rating. Example: a 10 ms pulse with I²R giving 0.3 J is acceptable if the J curve shows ≥0.3 J at 10 ms. For repetitive pulses, ensure average power (E·repetition_rate) plus steady load stays under continuous capability with margin (20–30%). 4 Mechanical, mounting & environmental constraints 4.1 — Mounting, airflow, and clearance requirements Mounting orientation and airflow materially change cooling. Use datasheet mounting notes (screw torque, pad isolation, clearance) and place resistors to maximize convective flow. ✔ DO Follow recommended torque Provide 10–20 mm clearance Ensure convective flow ✘ DON'T Enclose without forced cooling Rely on chassis alone Ignore vibration ratings 4.2 — Vibration, ingress protection, and ambient limits Verify operating temperature range and listed vibration/IP ratings against your environment. If datasheet lists, for example, −40 to +125°C and vibration N standard, confirm your shock/vibration spectrum matches. For harsh environments, require parts with sealed encapsulation or higher IP and add conformal coating or potting only after confirming it won’t trap heat and invalidate thermal limits. 5 Measurement, verification, and selection checklist 5.1 — Lab test protocol to validate datasheet claims Test plan: steady‑state test at planned ambient with calibrated load and thermocouples on resistor body, measure surface temperature vs. time until steady. Pulse test: apply single pulse of known energy, capture peak temperature with thermal camera, then apply repetitive pulses at intended duty cycle and log temperature rise. Safety: start at 50% of rated energy, use remote switching and current limiting, and record failure modes for root‑cause analysis. 5.2 — Component selection flow: matching ULV 500 N specs to system requirements Compute continuous Pdiss and required pulse energy. Add 20–50% safety margin for pulses. Add 20–30% for continuous derating at high ambient. Verify mechanical fit and mounting torque. Check tolerance and TC for circuit tolerance budget. 6 Common failure modes & troubleshooting 6.1 — Typical field failures linked to misinterpreted specs Common root causes: underrating continuous power (overheating), ignoring pulse repetition rate (thermal accumulation), inadequate airflow or improper mounting (elevated temps), and tolerance/TC mismatch (unexpected currents). Signs include discoloration, intermittent resistance drift, open‑circuit failures shortly after high‑energy events, and hotspots on thermal scans. 6.2 — Quick remediation steps and design changes Immediate fixes: reduce applied energy, increase cooling or airflow, add thermal gap pads or heatsinking, derate voltage/current. Long‑term: choose a higher J‑rated variant, increase safety margins, redesign snubber networks to reduce pulse energy, or distribute dissipation across multiple parts to lower per‑part stress. Summary Decoding the ULV 500 N 0.4 J datasheet is about matching continuous and transient specs to real‑world duty, reading thermal curves correctly, and validating with measurement. Focus on resistance/tolerance/TC, continuous power derating, and pulse J ratings; verify mounting and environmental constraints; and use lab tests to confirm safe operation before deployment. Key Takeaways Check resistance, tolerance and TC to set correct V/I and power margins; recalculated values must feed design protection and balancing. Use power vs. ambient derating curves to size continuous dissipation and apply a 20–30% safety derate in marginal environments. Interpret pulse J charts with pulse duration and repetition rate; for repetitive pulses derate pulse energy by 20–50% and validate with thermal imaging tests. FAQ What is the safe pulse energy for ULV 500 N 0.4 J per the datasheet? Datasheet pulse limits depend on pulse duration; a stated 0.4 J single‑pulse rating means a pulse delivering E = P·t ≤ 0.4 J at the referenced duration is acceptable. Always confirm the pulse‑duration curve and apply a conservative margin (20–50%) for repeated pulses or uncertain cooling conditions. How should I derate continuous specs for ULV 500 N 0.4 J in higher ambient? Use the power vs. ambient derating graph: find your ambient, read allowed Pdiss, and then apply an additional 20–30% margin for unexpected thermal coupling or reduced airflow. If no curve exists for your mounting, perform a steady‑state test to determine real thermal performance. What lab tests validate ULV 500 N 0.4 J datasheet claims? Validate with steady‑state power soak tests and controlled single/repetitive pulse tests. Instrument with calibrated current/voltage probes, surface thermocouples, and a thermal camera. Start at reduced energy (≈50% rated), ramp to intended levels, log temperatures, and compare to datasheet curves; stop if surface temperatures approach material limits.
  • ULV80 Resistor Data Report: Specs, Thermal & Size Guide

    The ULV80 resistor series is a common choice for high-power braking and load applications where thermal management and correct dimensional selection determine reliability and lifetime. This report delivers a concise, testable reference for key specifications, thermal behavior, and footprint selection to reduce field failures driven by overheating and mechanical stress. Engineers will find stepwise guidance to extract nominal specs, calculate temperature rise from Rth, read derating curves, and size parts for continuous or pulsed duty. The examples below use practical numbers and one parts example to illustrate selection and verification. 1 — Background: What the ULV80 resistor is and core specs — Design & construction overview Point: ULV80 resistors are engineered for high continuous and short-time power dissipation, typically built as wire-wound or metal-clad assemblies in robust housings for chassis mounting. Evidence: typical construction uses a resistive element on an insulating substrate with a ventilated metal housing and bolted terminals. Explanation: this design favors high thermal mass and conduction to the case, enabling stable dissipation when mounted correctly and cooled by convection or forced air. Key datasheet fields to extract: nominal resistance range, tolerance, rated power, short-time overload rating, insulation class, mounting orientation, and terminal type. Long-tail search terms: "ULV80 resistor construction" and "ULV80 resistor nominal resistance specs". — Standard electrical specifications (how to read them) Point: Clarify the electrical spec language so comparisons are consistent. Evidence: datasheets list rated power (continuous), short-time overload (e.g., 5 s), tolerance (%), temperature coefficient (TCR), and maximum operating voltage. Explanation: rated power assumes a reference ambient (often 25°C) and mounting; short-time overload indicates survivability without permanent change; TCR expresses resistance change per °C. Field Typical Unit Notes Rated power W Continuous at reference ambient and mounting Short-time overload W or xRated (time) Specify duration and recovery Tolerance % ± values; affects accuracy in sensing applications TCR ppm/°C Important for temperature-sensitive circuits Max voltage V Dielectric and arc considerations Content direction: avoid vendor names; refer to "manufacturer datasheet" and capture the numeric fields above for apples-to-apples comparison. 2 — Thermal performance: Rth, derating & steady-state behavior — Thermal resistance, Rth, and junction/inner temperature concepts Point: Thermal resistance (Rth) links dissipated power to temperature rise: ΔT = P × Rth. Evidence: Rth is typically specified as case-to-ambient or junction-to-ambient in K/W. Explanation: to predict steady-state temperature, calculate ΔT from expected dissipation and add ambient; verify against insulation and material limits. Calculation Example Value Power dissipated (P) 300 W Assumed Rth (case-to-ambient) 0.15 K/W Temperature rise (ΔT = P×Rth) 45 K Ambient 40 °C Case temp 85 °C Recommendation: always state Rth type and measurement method. Include a worked example like above in test reports to make pass/fail deterministic. — Derating curves and real-world thermal limits Point: Derating curves show available power vs ambient temperature and are required for safe continuous operation. Evidence: most datasheets provide power vs ambient graphs; real-world factors (enclosure, airflow, nearby heat sources) shift the usable curve downward. Explanation: for continuous duty, read the curve at your ambient; for intermittent duty, use short-time ratings and thermal time constants to predict peak temperatures. Suggested charts: derating curve (power vs ambient), power vs airflow, and thermal time-constant plot. Test conditions: mounting type, measured points (case, ambient, element if possible), airflow speed, and instrumentation accuracy. 3 — How to size & specify ULV80 resistors for your design — Calculating required wattage & safety margins Point: Start from worst-case dissipation, add derating and safety margin. Evidence: recommended safety factors range from 20% (well-cooled continuous) to 50% (harsh or variable duty). Explanation: sizing formula: Required_rating = (P_worst / derating_factor) × safety_factor. Sample Calculation: A pulsed application dissipates 450 W peak with a derating factor of 0.9 at ambient; applying 1.25 safety gives 450/(0.9)×1.25 ≈ 625 W → select next higher standard rating. Practical note: when a specific part code is referenced (e.g., "ULV 80 750 J FL=500"), limit use of that code in documentation to avoid confusion during procurement trials. — Thermal management and PCB/enclosure considerations Point: Mechanical mounting and airflow drive thermal performance. Evidence: chassis-mounting to a heavier heat sink lowers Rth; PCB mounting typically yields higher case temperatures. Explanation: use thermal pads or bolted mounting for conduction; keep minimum clearances for convection. ✔ Checklist: mounting torque, creepage/clearance, standoff heights, airflow path. ✔ Verification: thermocouple locations, steady-state time, and thermal imaging. 4 — Size, footprint & mechanical guide Point: Larger mass increases thermal capacitance; footprint affects conduction area. Evidence: datasheets provide dimensions. Explanation: use a dimension table to compare variants. Parameter Template Unit Length × Width × Height mm Mounting hole pattern mm Terminal type bolt/solder/eyelet Mass g — Mounting, vibration, and mechanical reliability Point: Mechanical stress can degrade terminations. Evidence: torque limits and vibration profiles are standard acceptance items. Explanation: specify terminal torque and provide strain-relief features for leads. 5 — Validation checklist & practical action items Test Plan Essentials: Required tests include steady-state thermal run, pulsed-power cycling, derating verification, and insulation/voltage tests. List measurement points and instrumentation (K-type thermocouples). Procurement Checklist: Request: full resistance range, tolerance, rated power, short-time overload, Rth definition, and dimensions. Include clauses for sample testing and lead time. Summary Read datasheets for rated power, short-time overload, tolerance, and Rth to determine usable power. Perform Rth calculations (ΔT = P × Rth) and consult derating curves for continuous duty. Size with a 20–50% safety margin; verify with steady-state and pulsed tests before sign-off. Capture mechanical data and validate mounting with vibration and thermal cycling tests. Next step: run the sizing calculation with your design’s worst-case numbers and schedule thermal verification. FAQ How should one use the ULV80 resistor datasheet to determine operating limits? Answer: Focus on rated power and the stated reference conditions. Extract Rth type and derating curve. Use ΔT = P × Rth to predict temperatures and ensure case temperature stays below maximum continuous rating. What thermal tests are essential for ULV80 resistor validation? Answer: Essential tests include a minimum 24-hour steady-state thermal run, pulsed-power cycling to validate short-time overload, and derating verification across ambient range. How to choose between a larger footprint or active cooling for high dissipations? Answer: If space allows, a larger mass with better conduction is simpler. If volume is constrained, design forced-air cooling. Choose the option that meets steady-state limits with verified margin.
  • ULV 400 Power & Thermal Analysis: Measured Losses & Cooling

    Bench data-driven evaluation shows that identical average dissipated power can produce case temperature differences of tens of degrees when mounting, airflow and transient load profile vary. This article presents measured-loss breakdowns, thermal-performance metrics and practical cooling strategies for the ULV 400 family. 1 Background & Key Electrical/Thermal Specs The ULV 400 N 50 J resistor is a metal-clad, wire-wound power resistor typically rated for high pulse and continuous dissipation in braking, load bank and drive applications. Construction—ceramic core, wire-wound element and a ventilated metal case—creates preferred thermal paths from element to case and then to chassis. ULV 400 mounting options strongly influence case-to-chassis conduction and thus effective thermal resistance and lifetime. Construction & Ratings Physically, these power resistors combine a resistive winding on an insulating core inside a metal housing. Rated power depends heavily on mounting and airflow; installers must treat mounting as part of thermal design. Critical Metrics Key metrics: Case temperature, ambient temperature, local surface hotspots, RθJA, RθCA, and thermal time constant. Tracking these drives derating decisions and lifetime projections. Measured Electrical Losses: Data Analysis Test Scenarios & Load Profiles Representative test profiles include continuous DC dissipation (200–600 W), pulsed duty cycles (10–50% at 100 ms–5 s), and realistic dynamic braking waveforms. A 500 W-average braking profile with 2 kW peaks produces very different hotspot behavior than steady 500 W. Loss Component Type Impact % Resistive Dissipation (I²R) Primary 85% - 95% Contact Resistance Heating Parasitic 5% - 15% Shunt Leakage / Error Ancillary < 2% *Quantify each contributor as a percent of total energy; in pulsed tests contact losses can shift thermal gradients significantly. Thermal Performance Mapping & Modeling Mapping Methods A prescriptive mapping method uses a thermocouple grid on anticipated hotspots (mount points, edges) plus an IR camera. Expect gradients of 5–30 °C between center and mounting screws. Record IR frames at 5–10 Hz to show hotspot evolution. Modeling & Response Extract steady-state Rθ (°C/W) via ΔT/P. A lumped R–C model often suffices for
  • ULV300 Resistor Performance Report: Real Test Data & Specs

    Independent lab tests across temperature and load profiles reveal how the ULV300 resistor family performs under real-world stress — from steady-state power handling to transient surge behavior. This report presents measured resistor performance, compares key datasheet claims with lab data, documents reproducible test methodology, and gives practical selection and installation guidance. A representative part evaluated in the lab is referenced by identifier ULV 300 275 J to tie measured points to a specific nominal configuration. Purpose: present measured performance, explain resistor specs and limits, detail reproducible test setups, and deliver concise selection and maintenance actions for engineers specifying braking, snubber, or load-bank resistors. Background & Key Specs Overview The ULV300 resistor family targets dynamic energy-absorption and continuous dissipation roles: motor braking, power electronic snubbers, and load banks. Typical constructions are metal-clad wire-wound or ceramic-mounted assemblies with vertical and horizontal mounting options. Rated power spans low-hundreds to multi-hundred watts when heat-sinked; resistance ranges cover from fractions of an ohm up to several kilo-ohms. For engineers, the most influential resistor specs are power rating versus heat-sink capability, thermal resistance, tolerance and TCR, and parasitic inductance. Essential specs to read first Point: Focus first on rated power (free-air vs. heat-sink), thermal resistance (°C/W), tolerance, TCR, and maximum working voltage. Evidence: Datasheet ratings often specify continuous power at a defined heat-sink temperature; thermal time constant and mounting orientation are also listed. Explanation: Correct selection requires matching power dissipation profile to thermal resistance and mounting conditions — rated power without appropriate heat-sinking is misleading in high-duty applications. Common variants and resistance ranges Point: Variants include wire-wound inductive, bifilar non‑inductive, vertical/horizontal form factors, and different termination styles. Evidence: Typical resistance bands run low-ohm (0.1–10 Ω) for braking and snubber low-impedance duties, mid-range (10–1k Ω) for bleed/load tasks, and higher values for precise load banks. Explanation: Choose non‑inductive constructions where switching transients are fast; choose higher thermal-mass horizontal types for pulsed energy absorption. Lab Test Results: Power Handling & Thermal Performance Measured continuous power tests compared free-air and heat‑sinked conditions. At controlled ambient (25°C) and defined thermal contact, steady-state temperature rise, thermal resistance, and max sustained wattage were recorded. Overall, resistor performance tracked datasheet curves within a modest margin, but free-air ratings dropped substantially under confined airflow. "ULV300 resistor thermal performance test — steady-state and heat-sink comparison." Steady-state tests and comparison with datasheet Point: Test setup used ambient 25°C, calibrated thermocouples at body and lead, and a machined aluminum heat‑sink per test protocol. Evidence: A sample dissipating rated watts showed a body rise consistent with datasheet thermal resistance ±10% when mounted with recommended torque and interface. Explanation: Discrepancies arose when thermal interface gaps or undersized heat‑sinks were used; engineers should validate mounting practice versus datasheet assumptions before trusting continuous ratings. Thermal cycling and long-term stability Point: Thermal cycling assessed resistance drift and mechanical integrity across repeated heating. Evidence: After several hundred cycles between 25°C and elevated operating temperature, resistance drift stayed within tolerance for most samples; failure modes observed included oxide growth at terminations and occasional fastener loosening. Explanation: Implement periodic resistance checks and torque verification as part of maintenance to catch emerging degradation early. Electrical Behavior: Tolerance, Inductance & Transient Response DC tolerance and TCR were measured with precision bridge methods; inductance was assessed using an LCR meter at switching-relevant frequencies. Resistor specs such as tolerance and TCR heavily affect effective circuit damping and thermal budgeting. Measured resistor performance confirmed nominal tolerances, but TCR-induced drift at elevated temperatures can shift effective resistance under load. Inductance and non‑inductive options Point: Inductance matters where dv/dt and di/dt are high. Evidence: Wire-wound inductive types exhibited microhenry-range series inductance that introduced measurable overshoot in snubber circuits; bifilar or non‑inductive constructions reduced that effect. Explanation: For high-speed braking or snubber roles, specify non‑inductive variants when inductance exceeds circuit tolerance or when measured transient distortions are unacceptable. Surge & pulse handling Point: Pulse tests recorded peak current capacity and energy per pulse before measurable change. Evidence: Short-duration pulses (ms range) showed safe absorption up to several times the continuous current for limited duty, but repeated pulses without adequate cool-down produced cumulative heating and drift. Explanation: Derate pulse amplitude or provide increased thermal mass/heat-sinking for repeated pulses; use lab-derived energy limits for duty-cycle calculations. Testing Methodology & Reproducibility Testing ULV300 resistor performance used calibrated instrumentation: precision current sources, NIST-traceable thermocouples, high-sample-rate data loggers, and repeatable mounting fixtures. Key controls: ambient stability ±1°C, defined thermal interface (shim/compound), and sample size (n≥3) for each data point to support statistical confidence. Recommend tagging test rigs with calibration dates and failure criteria. Recommended test rig and measurement checklist: Focus on concise checklists. Essential equipment includes programmable DC load, oscilloscope, LCR meter, and torque wrench. Common pitfalls are poor thermal contact and overlooking lead losses. Data logging & analysis tips: Use high sampling (≥100 kS/s) for pulses and 1–5 s for thermal drift. Compute thermal resistance as ΔT/ΔP from steady plateaus. Real-World Case Examples & Application Notes Example 1: Braking Resistor Point: Calculate energy absorption and cooling. Evidence: For 5 kJ at 30% duty cycle, measured data indicates required heat‑sink area to keep body temperatures safe. Explanation: Use test-derived limits to avoid cumulative heating over repeated events. Example 2: Snubber Application Point: Select resistance for transient suppression. Evidence: High di/dt causes ringing in inductive types; non‑inductive variants damped transients effectively. Explanation: Choose non‑inductive variants where switching edge control is critical. Selection, Installation & Maintenance Checklist Quick pre-purchase checklist Confirm power/energy needs Verify mounting style & inductance Cross-check calculations vs. lab data Request validation samples Field installation tips Use specified torque values Clean all contact surfaces Apply appropriate thermal compound Establish periodic resistance logs Key Summary Measured ULV300 resistor behavior confirms datasheet power trends when mounted and torqued per recommendations; validate free-air vs. heat-sink conditions for accurate resistor performance assessment. Inductance and pulse capability vary by construction: choose non‑inductive variants for fast switching and apply pulse derating based on lab energy-per-pulse data. Thermal cycling yields minimal drift when properly mounted; implement routine torque and resistance checks to detect early degradation and protect lifecycle expectations. FAQ How does ULV 300 275 J compare to datasheet continuous ratings? Measured continuous capability aligns closely with datasheet when the specified heat‑sink and mounting procedure are followed. Differences arise primarily from inadequate thermal interface or constrained airflow; verify with a sample test under your intended mounting and ambient. What pulse energy can ULV 300 275 J safely handle repeatedly? Repeated pulse capacity depends on pulse width and cool-down interval. Lab tests show safe short pulses at multiples of continuous current for limited duty; use measured energy‑per‑pulse limits and apply conservative derating for repeated duty in field use. What monitoring should be used after installation of ULV 300 275 J? Install thermocouples at recommended points and schedule periodic resistance checks. Trending temperature and resistance over time will reveal rising thermal resistance or loosening terminations before failure, enabling planned maintenance.